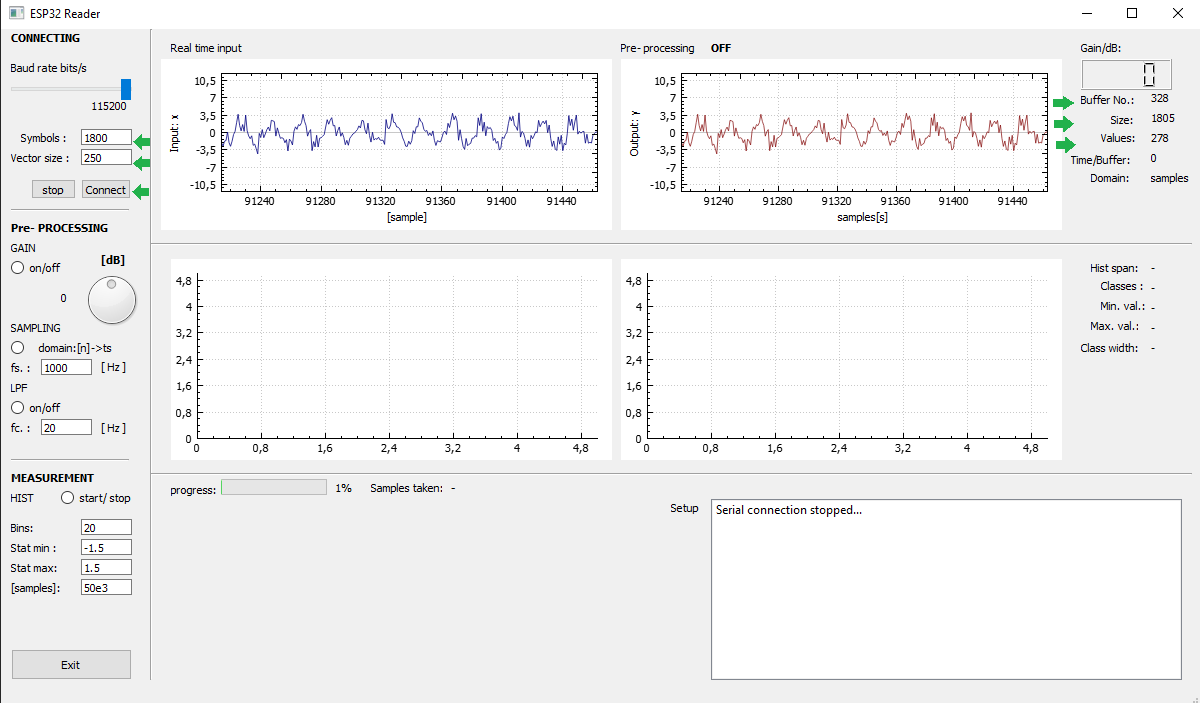
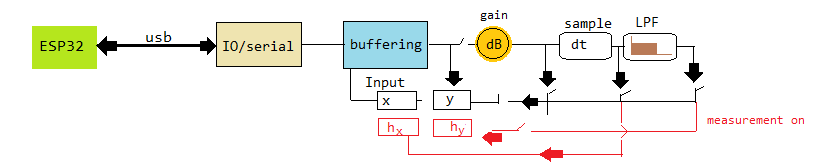
Real time processing of signal received from ESP32 chip
Simple low frequency circuite prototype that could be used to monitor bio-signals, for example such as ECG device.
ESP32 processing limit that the autor has found is decribed here:
Appendix/c++/ESP32 max ..
Practically if sensors attached, ADC sampler is at its best on approx. 4kHz, so "simulating signal" outperforms real possibilities
Neverthless, this app provides a sound ground for practicing of in general
For this prototype- no externals are needed, and overall process is still divided into following categories:
sensing ( sensors attached, in this first version case not necessary)
sampling/ or generating values in this case
transmision via USB/Serial or some protocol to PC (bluetooth can do the same)
receiving it on PC, buffering and preparing
pre-processing: suche as filtering, gaining, etc ...
measuring, or processing pre-processed values
displaying the results or DAQ
My big mistake here: I did not use "timers" ! (VERY bad decision I've made, lesson learnd !)
Example of random normal signal input analysis
Project overview
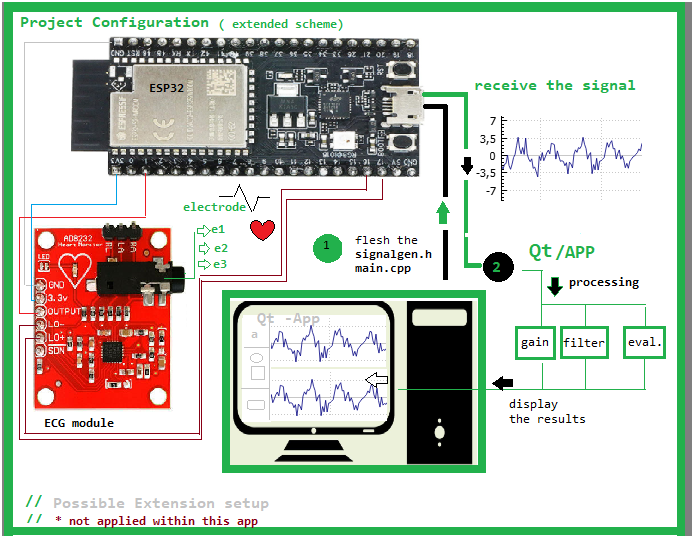
Flash the previous script to ESP32 chip, just as shown on previous page "example 2"
step back here
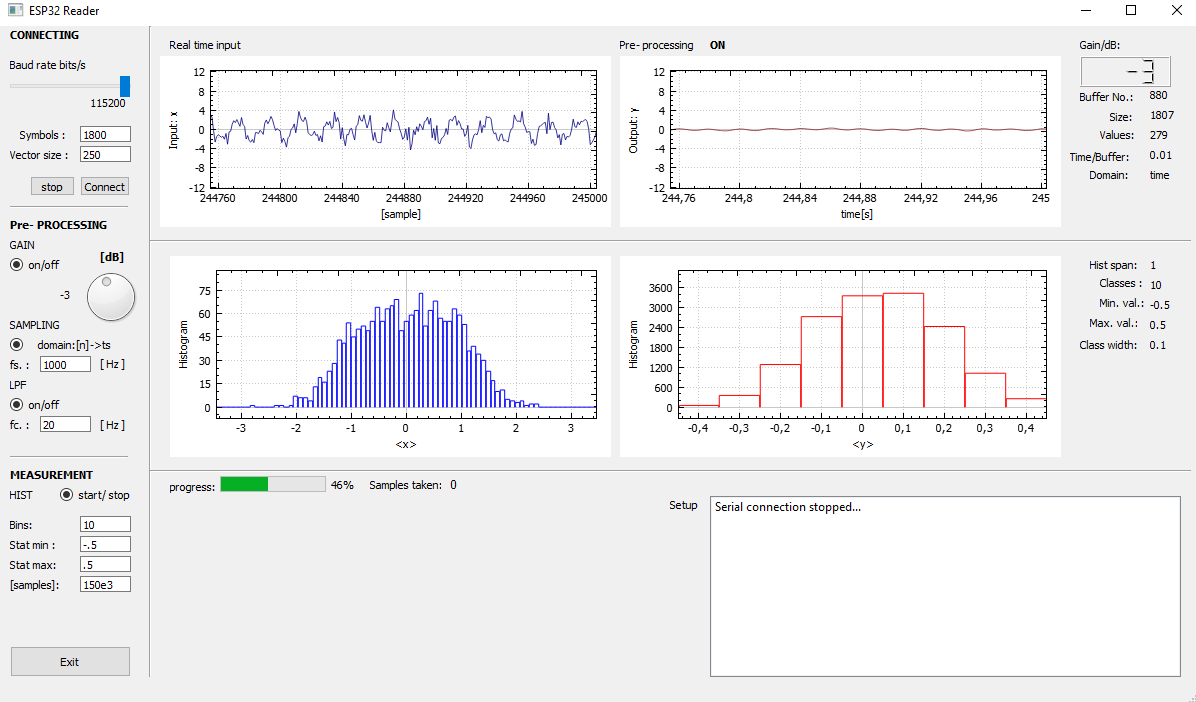
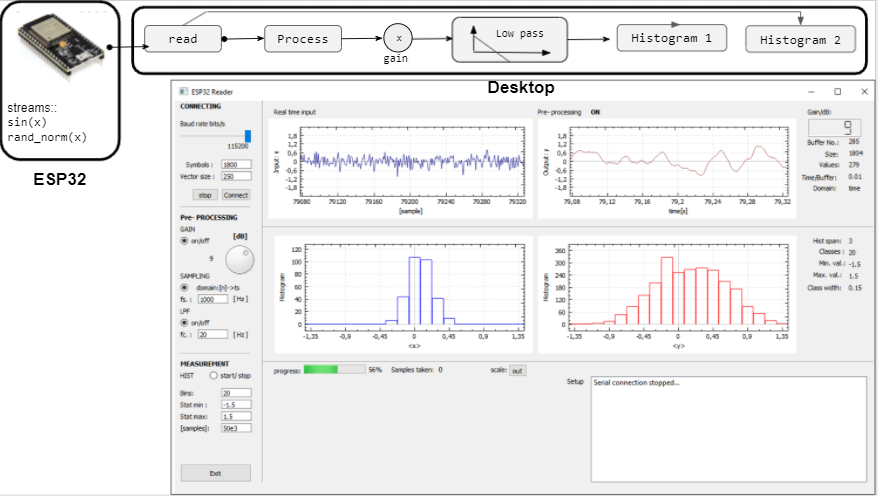
Plug the usb cable to the PC with running this APP and to ESP32
For ECG adaptation, filter sholud be changed to the "notch", or "butterword bandstop" ~fc 50Hz
withouth add. shields as shown as possible extension, for more details visit link
IOT Based Heart Monitoring
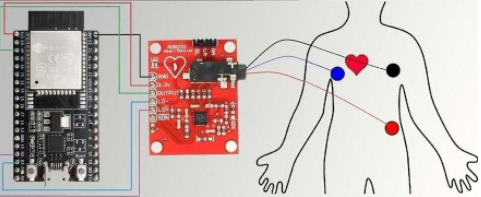
For this project, an extension could be utilized as here shown with ECG el. module
For this adaptation visit here:
[ECG IOT based heart monitoring]
Repeat filters:
here
Qt/ESP32 reader tutorial
For this app I have choosen to generate sine on random signal
After clicking on "connect" signal should appear in both scopes Inut:x and Output: y
Beware, this will not work if baud rate has not been given correctly
Number of symbols determine how long the sequence should be before it is converted to the numeric vector, by default I have set it to 1800
Symbols sequence is a large string like: "0.123*1.214* ... etc "
If number of symbol is greater of this number buffer is cleaned of values and another one is starts, wich is counted in Buffer.No
Number of symbols varies within the buffer ( which is not quite the best option at all, tough learning by doing though)
So number of float size three digits numbers found within current buffer has some number of values (measured right)
Smaller the buffer size, faster the whole streaming process (rapidly faster, but not stable, means interrupts occur)
Therefore the true buffer size is displayed on the right size and differs from given defaults
By clicking stop stream is going to be cut of from the chip, it stops the stream
Consider changing the number of symbols to 580
Now it runs pretty faster but with some interrupts, which are not here due to the code itself
It gets to its stability margins, somehow?
It reads now only 91 values and varies in size around 580
On X axis you have number of samples read from stream and you have the same number of samples as you put within the "vector size"
Consider changing the vector size, it changes number of points within the window
App functionality explanation
Signal is read by the QSerial insance and buffered as previously explained
Inputs are shown in first two window within the "Connecting" section
If gain is not used, both windows are showing the same signal i.e. input
If gain is used, by enabling radio button, right window is going to show amplified signal
If gain is used, by enabling radio button, and sampling is used you are going to see gained signal on time axes
If gain is used, and sampling is used, and filtering is used, right window shows amplified, sampled and filtered signal
If gain is used, and sampling is used, and filtering is used, and measurement is on:
histogram is calculated with defaults and shown within the right window on second row
If gain is used, and sampling is used, and filtering is OFF, and measurement is on:
histogram is calculated with defaults and shown within the left window on second row
Example
Press the gain radio button
scroll the gain to -6dB, value is shown also in Gain/db LCD like display right
Check the sampling rate 1kHz, time axes is recalculated
signal should be damped and shown in real time within green rectangle
Signal is now routed trough branches as shown within the graph, marked with green
Hint in case you are not familiar with dB as unit: 0 dB means multiply evertyhing with 1x
Now clean the signal of noise; turning the Low pass filter on "radio button"
Signal is now cleared of noise, hence only sinewave should have left, gain it +4dB
Now set the measurement section like this:
Bins:40
Stat min:-5
Stat max: 5
Samples: 500.000
Which translates: put 500.000 value to the histogram with 40 bins, ranging from -5, to 5
Press the radio button start/stop
Progress bar is going to refresh automatically after reaching 500e3 samples and restart
Measurement is done continuously, refreshing when 500e3 values sorted to histogram and histogram reploted until start/stop unchecked
If LPF is now unchecked
Continuous mesurement continues on the left graph, second column Pre-PROCESSING section, green window
Means: signal which did not pass through filter is filling the histogram values
Both signal clearly differ in their distributions... as expected
This is how both signal distributions are finally obtained
Strange occurence is that, less bins means more time for processing histogram
Means: signal which did not pass through filter is filling the histogram values
Both histograms can use different values for distribution evaluation
( damped signal takes different x-domain, hence processes are decoupled )
Few real time procesing examples:
Harmonic input
Sine and random
see first ECG , from year 1902
here